Quick answer
- What this covers: The Hermes Agent dashboard is your command center for an AI employee.
- Who it’s for: People evaluating hermes agent.
Most business owners have the same fear before deploying an AI agent: "I won't know what it's doing." The Hermes Agent dashboard exists to answer that fear directly. It shows you exactly what your agent did, what it's doing now, and what it's queued up next.
This guide covers the Hermes Agent dashboard in plain terms. What each section shows. What you can control from it. How business owners actually use it day-to-day, not in a demo, but in real operations.
Key takeaways:- The dashboard is a command center, not a monitoring wall. You give instructions, review flagged items, and adjust priorities. Not watch a firehose of activity logs
- Your daily review takes 5 to 8 minutes. The dashboard surfaces what needs you, hides what doesn't
- Everything the agent does is logged and reversible. Sent the wrong email draft? You can see it, understand why, and correct the behavior so it doesn't repeat
- The flagging system is how Hermes asks for help. Not a chatbot popup. A prioritized queue of decisions that genuinely need your judgment
- What the Dashboard Is For
- The Five Main Dashboard Sections
- How the Flagging System Works
- Activity Logs: What Got Done and When
- Agent Configuration From the Dashboard
- How Business Owners Use the Dashboard Day-to-Day
- FAQ
What the Dashboard Is For
The Hermes Agent dashboard does one thing: puts the right information in front of you at the right time so you spend as little time managing the agent as possible.
That sounds backward. Shouldn't more information mean more management? No. The problem with most automation tools is that they produce noise. Notifications for everything. Logs that require interpretation. Status screens that answer "is it running" but not "is it doing the right things."
Hermes is an AI employee. The dashboard is how you manage that employee, the same way you'd check in with a great human coordinator: briefly, focusing on exceptions, trusting routine work is handled. Research on management by exception, delegating routine decisions and focusing attention only on deviations, shows it reduces manager time spent on low-value tasks by up to 40%.
For context on what Hermes does before diving into how you oversee it, see what is Hermes Agent.
The design principle: if it doesn't need you, it shouldn't bother you.
The Five Main Dashboard Sections
1. Today's Briefing
The top of the dashboard starts every session with a summary of what happened while you were away. A typical briefing from month 3 of operation looks like:
- 7 new leads handled (5 responded to, 2 flagged for your input)
- 14 client communications processed (12 sent autonomously, 2 in draft for review)
- 3 meeting requests scheduled
- 2 items need your decision
That's the briefing. Six lines. You know whether today needs 5 minutes or 20 before you open a single email.
The briefing does not show you everything the agent did. It shows you what matters. Full logs are available one click away in the activity section.
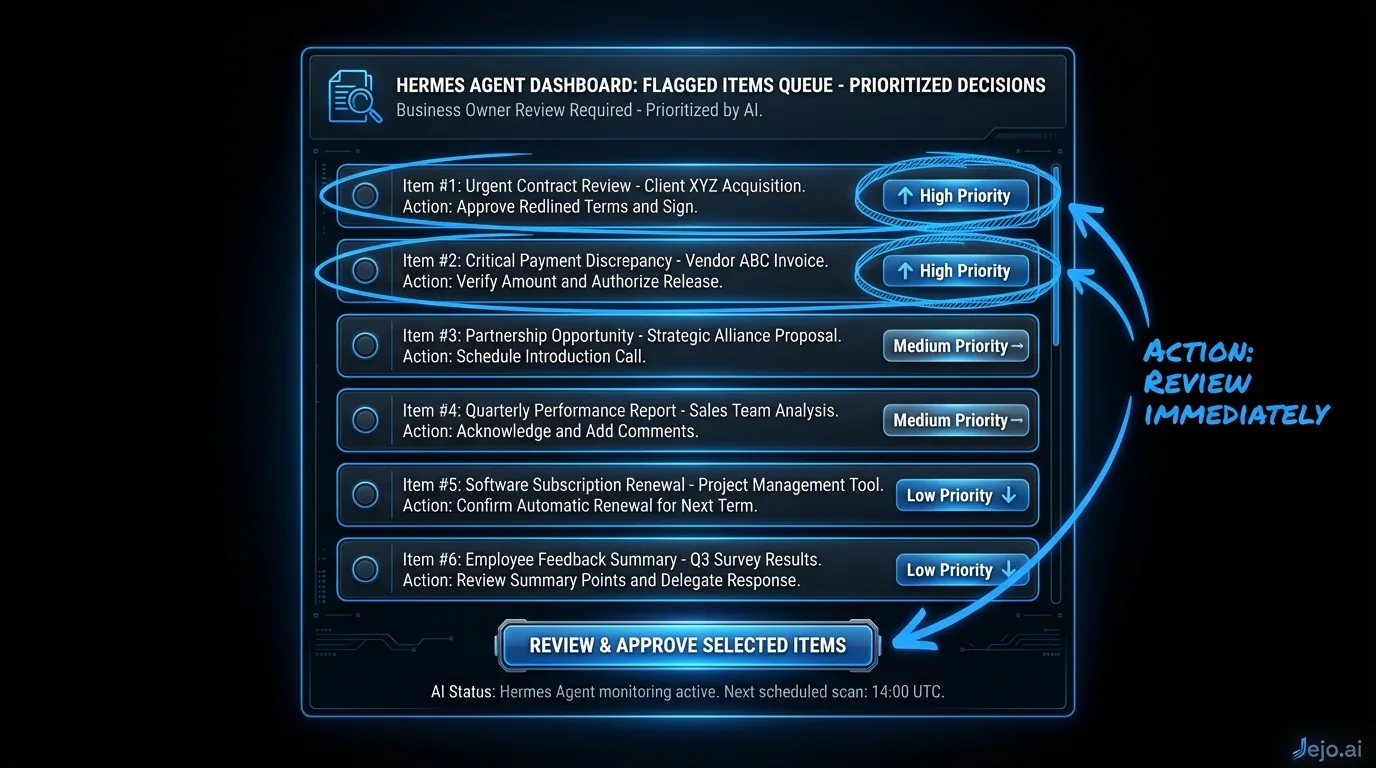
2. Flagged Items Queue
This is the section you actually work in daily. Flagged items are the decisions Hermes escalated to you because they fell outside its confidence threshold or your pre-set rules.
Common flagged categories:
- Pricing questions outside your stated range
- Leads that don't match your standard qualification criteria but show strong signals
- Client complaints or escalation language detected in an email
- Scheduling conflicts requiring a judgment call
- Unusual requests not covered by your established patterns
Each flagged item shows you: what triggered the flag, the relevant context (the email thread, the CRM record, the history), what action Hermes would have taken if it could, and your available responses.
Your response options are typically: approve the draft action, modify it, reject and instruct differently, or mark as a rule update (which means "teach the agent how to handle this category in the future without asking").
That last option is how the agent gets smarter. Every rule update you make from the flagged queue reduces that category of flags going forward.
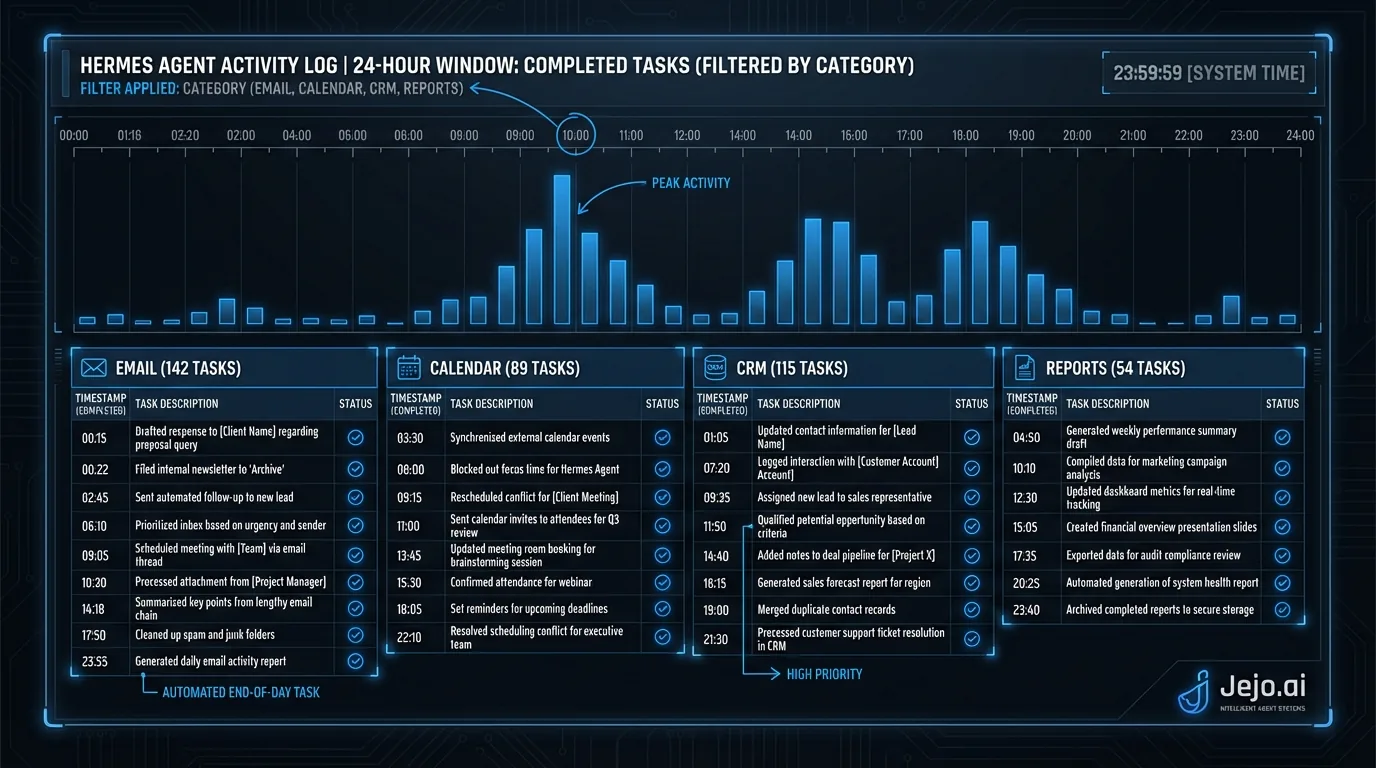
3. Activity Log
The full log of everything the agent did in the past 24 hours, 7 days, or any date range you select. Filterable by task category: email, scheduling, CRM updates, reports, client communications.
Each log entry shows: timestamp, task type, the specific action taken, which tools were used, and the outcome.
This isn't a wall of text. It's structured data you can scan quickly. Most business owners look at the log once a week to spot patterns, not daily. If something unexpected surfaces in a flag, you trace back through the log to understand the chain of events.
The log is also your accountability record. If a client says "I never received that follow-up," you can verify in seconds whether Hermes sent it, when, and to what address. That kind of audit trail takes hours to reconstruct manually.
4. Agent Goals and Tasks
This section shows you the active goals running on your agent. Goals are the standing instructions that drive autonomous behavior. Examples:
- "Respond to all new inbound leads within 5 minutes with a qualification email"
- "Send weekly project status updates to all active clients every Monday at 9 AM"
- "Flag any email containing the words 'cancel,' 'refund,' or 'unhappy' for immediate review"
- "Schedule follow-up touchpoints at 3 days, 7 days, and 14 days for leads who don't book"
You can view, edit, pause, or delete any active goal from this section. Adding new goals is as simple as writing a plain-English description of what you want the agent to do. No coding.
The task queue underneath goals shows the next 48 hours of planned actions: scheduled emails, follow-ups queued, reports due. You can see what's coming before it happens.
5. Performance Metrics
A summary view of agent output over time. The metrics that matter for business owners:
| Metric | What It Measures | Typical Month 3 Performance |
|---|---|---|
| Response time (leads) | Avg minutes from inquiry to first reply | 3-4 minutes |
| Autonomous completion rate | % of tasks handled without escalation | 88-94% |
| Email handled | Total emails processed in the period | 200-600/wk depending on volume |
| Meetings scheduled | Calendar bookings from agent activity | Varies by business |
| Tasks escalated | Items that went to your flagged queue | 6-12% of total |
| Correction rate | % of drafts you've edited vs approved | Trends toward 0 by month 3 |
The performance view isn't a vanity dashboard. It tells you whether the agent is genuinely handling your workload or just shifting it around. If your autonomous completion rate is below 80% by month 2, there's a calibration issue worth addressing with your Jejo.ai account manager.
How the Flagging System Works
The flagging system is the most important concept in the dashboard. Get this right and your daily dashboard time stays under 10 minutes.
Hermes flags an item when it encounters:
- A rule gap. The situation doesn't match any existing instruction. Hermes knows it's in territory it hasn't been trained on, so it asks.
- A confidence threshold failure. The agent calculated probabilities on the best action and nothing cleared 80%. It flags rather than guess.
- A hard-stop category. Categories you've explicitly told the agent to always escalate, like pricing negotiations above a certain threshold or any communication with a specific named client.
- A detected risk signal. Complaint language, legal terms, unusually formal tone from a normally casual client. Hermes surfaces these even if it technically could handle the task.
When you resolve a flagged item, you have three options:
Handle and move on. You take the action yourself. The agent logs what happened but doesn't learn a new rule. Handle and teach. You take the action and mark "treat similar situations like this in the future." The agent adds a rule and reduces flags in this category going forward. Override the flag criteria. You decide the agent should handle this category autonomously from now on. The escalation rule is removed. This is how you expand the agent's autonomy over time.By month 2, most business owners are expanding autonomy weekly. By month 3, the flagged queue is mostly genuine edge cases, not training noise.
Activity Logs: What Got Done and When
The activity log answers the question every business owner wants to ask an employee: "What did you actually do today?"
Hermes logs every action at a granular level. A single lead-response task generates entries like:
- 11:32 PM: New inquiry received from form submission (Marketing)
- 11:32 PM: CRM lookup initiated for email domain
- 11:32 PM: Matched to ICP criteria (company size, industry)
- 11:33 PM: Draft response generated using qualification template
- 11:33 PM: Response sent to [email protected]
- 11:33 PM: CRM record updated with lead status: Qualified, contacted
- 11:33 PM: Follow-up task queued for Day 3 touchpoint
That's 7 log entries for one task. Multiply by 20 to 50 tasks per day and you understand why the briefing summary exists. Nobody needs to read 300 log entries daily. But when something goes wrong, or when a client disputes something, the granular record is there.
The log also shows you operational patterns you'd never notice manually. "80% of our qualified leads come in between 6 PM and 10 PM." "The follow-up at day 7 converts at 3x the rate of day 3." "Client complaints spike on Thursdays." You can see these patterns because the agent logs everything systematically. MIT Sloan Management Review research on data-driven small businesses shows that systematically logged operational data leads to measurably faster decision-making and better resource allocation.
Agent Configuration From the Dashboard
The dashboard isn't just for reviewing past activity. It's where you configure the agent's behavior without technical knowledge.
Goal management. Add, edit, or pause standing instructions using plain English. "Start adding a 'book a call' CTA to all follow-up emails after day 5" is a real goal you can type and activate in under 30 seconds. Response templates. View and edit the draft templates your agent uses for different communication categories. Change the tone, add new product information, update pricing references after a rate change. Escalation rules. Define what always gets flagged, what never gets touched, and what the agent handles freely. If you're running a promotion, you can temporarily lower the escalation threshold on pricing questions. Integration status. See which tools are connected and their sync status. If your CRM connection drops, the dashboard flags it before the agent starts operating without current data. Team access. If you have a team member who should see the activity log or handle flagged items, you can grant them dashboard access without giving them full admin control.This is the full control panel. Everything Hermes does is configurable from here without touching a line of code. For a managed deployment through Jejo.ai, your account manager handles initial configuration. The dashboard is your ongoing steering mechanism.
How Business Owners Use the Dashboard Day-to-Day
Here's what routine dashboard use looks like at month 3 of deployment.
Morning check, 8 minutes. Open the briefing summary. Read the overnight activity summary. Open the flagged queue, which typically has 2 to 4 items. Handle them. Scan the task queue to see what's coming today. Done. Mid-day spot check, 2 minutes. Quick scan of flagged items to see if anything time-sensitive came in. Usually nothing. Close the tab. Weekly review, 15 minutes. Look at the performance metrics for the week. Review the activity log at a summary level. Check if any new goal updates would improve performance. Decide whether to expand any escalation categories based on the week's patterns.That's the full dashboard interaction for a business owner running Hermes autonomously. Less than 2 hours per month of active oversight for an agent handling 25 to 35 hours of work per week.
The comparison to managing a human employee is instructive. A capable human coordinator requires check-ins, status meetings, feedback sessions, and oversight time. Gallup research shows managers spend an average of 7 to 10 hours per week just on administrative oversight tasks. Hermes surfaces the same information in a structured format that takes a fraction of the time to process.
For a full comparison with other AI agent platforms, see Hermes Agent vs OpenClaw. For pricing details, see Hermes Agent pricing.
FAQ
What does the Hermes Agent dashboard actually show?
The dashboard shows five main sections: today's briefing summary, flagged items requiring your decision, a complete activity log, your active agent goals, and performance metrics. It's designed to surface what needs you and hide what doesn't. Most business owners spend 5 to 8 minutes per day in the dashboard.
Can I see everything the agent did?
Yes. The activity log records every action the agent takes at a granular level, including timestamps, which tools were used, and the outcome. You can filter by category, date range, and task type. By default, the dashboard shows you a summary. The full log is one click away.
How do I teach the agent from the dashboard?
When you resolve a flagged item, you can mark it as a "teach" action, writing a plain-English rule for how to handle similar situations in the future. You can also directly edit goals in the configuration section, which updates the standing instructions driving agent behavior.
What happens if the agent makes a mistake?
Every action is logged. If an error occurs, you can trace back through the activity log to identify exactly what happened and why. You can then update the relevant goal or escalation rule from the configuration section to prevent it from recurring. See Hermes Agent review for real-world accuracy data from business owners.
Do I need to check the dashboard every day?
By month 2, flagged item volume drops to the point where many business owners check in every other day. The morning briefing is designed for exactly this workflow. If you prefer, you can configure email notifications for time-sensitive flags, which means you only open the dashboard when something genuinely needs your attention.
How long does Hermes Agent take to set up?
The dashboard is available within 48 hours of your kickoff call when you deploy through Jejo.ai. Your involvement for setup is 30 minutes: one call to map your operations and connect your tools. From there, Jejo.ai handles the technical deployment. The full calibration period is 4 weeks, but the dashboard is live and tracking activity from day one. See Hermes Agent setup for the full timeline.